Those who follow the blog will have noticed that many of our posts discuss research that uses the Understanding America Study, a nationally representative Internet Panel of approximately 8,000 respondents. The UAS is actively creating an in-depth portrayal of the people in the U.S. – their stories, their daily lives, their preferences and their opinions. As an Internet-based panel, respondents answer our surveys on a computer, tablet, or smart phone, wherever they are and whenever they wish to participate. Unlike most Internet-based studies, however, the UAS is address-based, meaning that respondents are randomly drawn from postal addresses and are invited to participate by mail. For those who are interested in participating but who lack Internet access, a tablet and Internet connection are provided to ensure even hard to reach groups are represented.
The UAS asks about a wide range of topics. From detailed questions on participants’ finances to how satisfied they are with their life; from measuring their knowledge of Social Security rules to their personality traits; from their health status and history to their opinions on current events. The UAS also assesses respondents on domains ranging from their financial literacy to numeracy and understanding of probabilities.
The panel-nature of the UAS enables researchers to analyze the trajectories of respondents, how things have changed for them over the years, and how their past affects their present. Several surveys are repeated biannually, which allows researchers and analysts to track changes in the population on particular issues such as health, financial wellbeing, and retirement preparedness.
The UAS innovates by introducing technological innovations to the survey realm, and thus pushes forward to expand our understanding of our panel members, and through them, the country. One example of this are recent pilot surveys where some respondents agreed to use wearables, devices that track specific vitals through the day, such as heart rate sleep patterns. The data from these devices are then used by researchers to answer questions about how people’s daily activities affect their health in real time, opening up a window of opportunity for new research and analysis.
The UAS encourages researchers from any institution and the public in general to use the de-identified data we collect. For this, it is important for researchers to be able to navigate the wealth of data we provide. Researchers are welcome to explore the large number of variables contained in the more than 200 surveys (and counting!), each with its own dataset that can be browsed here. One can browse the content of the surveys right away. To access the data, one just registers for an account and then returns a signed data-use agreement.
We recently released a new version of the UAS Comprehensive File, a single-data file that aims to make it easier for researchers to utilize the wealth of data in the Understanding America Study. This version of the dataset includes longitudinal data from a number of surveys that range in topics from financial literacy to several domains of cognitive ability to people’s knowledge about Social Security and financial behaviors.
The main goal of the Comprehensive File is to provide simpler access to more data for all researchers and analysts. The dataset combines data from the repeated “core” surveys in the UAS. One click allows registered researchers to download a single data file that contains the variables from the core surveys that are fielded bi-annually. The Comprehensive File includes variables in the following domains:
- Health, including detailed health status and history questions from the Health and Retirement Study (HRS) surveys;
- Employment status and history; Income and Wealth;
- Financial services and decision-making;
- Retirement and Social Security. Including retirement and pension questions from the HRS; Knowledge and access to information about Social Security;
- Financial literacy and financial well-being
- Ability, including: Understanding Probabilities; Numeracy scores;
- Personality traits;
- Life satisfaction.
The Comprehensive File also helps researchers who are considering developing their own surveys. Researchers interested in fielding their own questions to a nationally representative sample can formulate the questions that are unique to their survey, and then link their data to the Comprehensive File for the complementary variables they need. We update this file quarterly to include new survey responses and additional measures.
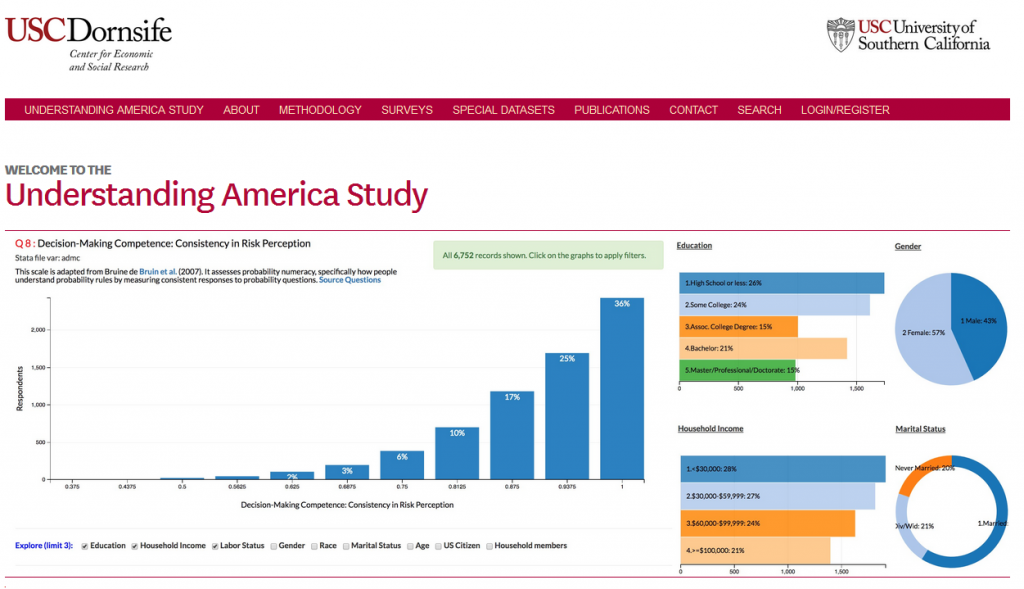
We also aim to increase access for all, including those who do not use statistical programming software. The Comprehensive File is the source of the UAS-data visualization tool. No experience with statistical software is needed to use it. It facilitates analysis of the data from the Comprehensive File in user-friendly but powerful ways. A user can create graphics that show the distributions of variables for the country as a whole, and compare it for different population subgroups broken down by education levels, gender, age and others. As further rounds of data are added, users will be able to see how variables have changed across time, possibly broken down by population subgroups. In this way, a user can easily answer questions such as: How has financial literacy evolved across survey waves? Do women report being happier than men? How has average income changed for Americans with a high school degree? And produce pleasing visuals while doing that!
You can learn more of these exciting tools at uasdata.usc.edu.