The 2016 US presidential election is noteworthy for the low approval ratings of both major party candidates. For example, as of November 2, 2016, poll averages on RealClear Politics show 53.6% of respondents rating Hillary Clinton unfavorably, while only 43.9% of respondents rate her favorably; 58.9% of respondents rate Donald Trump unfavorably, while only 38.1% of respondents rate him favorably. Leaving aside those who vote for a minor party or write-in candidate, there is no question that on election day, many voters will think of what they are doing as voting against one of these two candidates rather than voting for one of them.
Out of all the many candidates who campaigned in the primaries to be President of the United States, how did the electoral system choose two who are so widely despised as the candidates for the general election? The party system for choosing the candidates for the general election may bear some of the blame, especially in an era of high political polarization. But another important characteristic of the current US electoral system is that one can only make a positive vote for a candidate, not a negative vote. That is, in the current voting system, voters can only express one attitude towards a candidate—the belief that she or he would make the best president among the candidates. But, should this be the only attitude that comes into play when picking the most powerful person of the free world? Shouldn’t our voting system give voters a chance to say which candidate they think would make the worst president before we deposit the U.S. nuclear codes in a new president’s hands? And more generally, shouldn’t our voting system take into account how much voters like or dislike the candidates?
Our work on collective decision-making mechanisms for incorporating subjective well-being data into policy-making led us to stumble on a class of voting systems for multicandidate elections that we think might help in avoiding outcomes that a large share of people hate. For us, this research program began with “Aggregating Local Preferences to Guide Marginal Policy Adjustments” (pdf download) by Dan Benjamin, Ori Heffetz, Miles Kimball and Nichole Szembrot in the 2013 AEA Papers and Proceedings. More recently, “The Relationship Between the Normalized Gradient Addition Mechanism and Quadratic Voting” by Dan Benjamin, Ori Heffetz, Miles Kimball and Derek Lougee (on which Becky Royer worked as an extremely able research assistant) draws some connections between what we have come to call the “Normalized Gradient Addition (NGA) mechanism” and a broader literature.
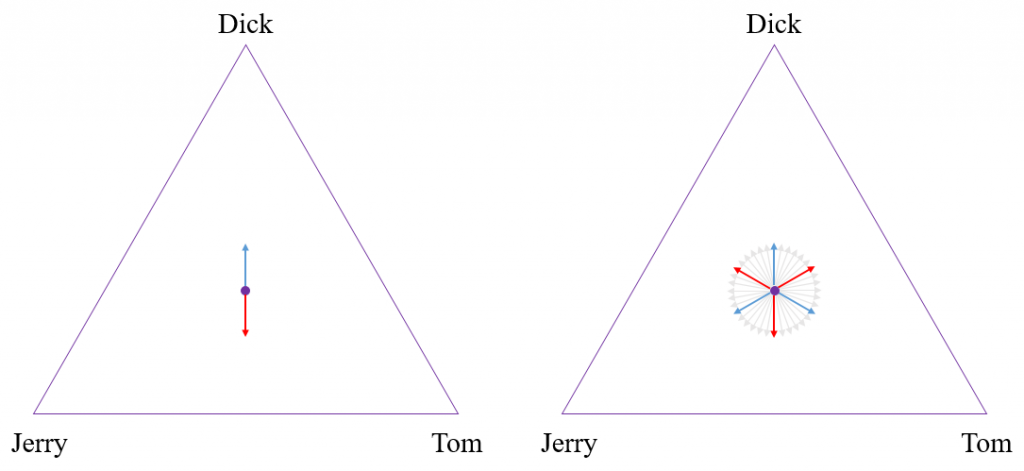
To better understand the NGA mechanism as applied to multicandidate voting, consider the simple case in which there are three candidates – Tom, Dick, and Jerry – as shown in Figure 1 above. In this case of multicandidate voting, we represent how close each candidate is to winning by a point in a triangle. The three vertices represent victory for one particular candidate, while the edges opposite a vertex represent that candidate being eliminated. The distance from each edge can be thought of as a kind of “notional probability” that a particular candidate would win if the selection process were somehow cut short and terminated in the middle of the action. Thus, the points in the interior of the triangle represent an unresolved situation in which each candidate is still treated as having a chance. Voters can choose vectors of a fixed unit length in any direction within the triangle. The current position in the triangle then gradually evolves in a direction determined by adding up all of these vector votes.
To illustrate, In the picture on the left of Figure 1, there is a blue arrow pointing from the starting point upwards towards Dick. This is the only movement that our current voting system allows for; a positive vote for one candidate. But there is also the red arrow, pointing in the opposite direction. This corresponds to a “negative” vote, in which the voter’s only goal is to vote against Dick. Not only would our mechanism allow for both these positive and negative votes, but it would allow voters to have even more complex votes based on their specific preferences for each of the candidates, as indicated by all of the arrows in the picture on the right. This example can be extended to higher dimensions, in which there are more than three candidates. For example, the policy space would be modeled as a tetrahedron for four candidates, or a simplex for five or more candidates, with a vertex for each candidate.
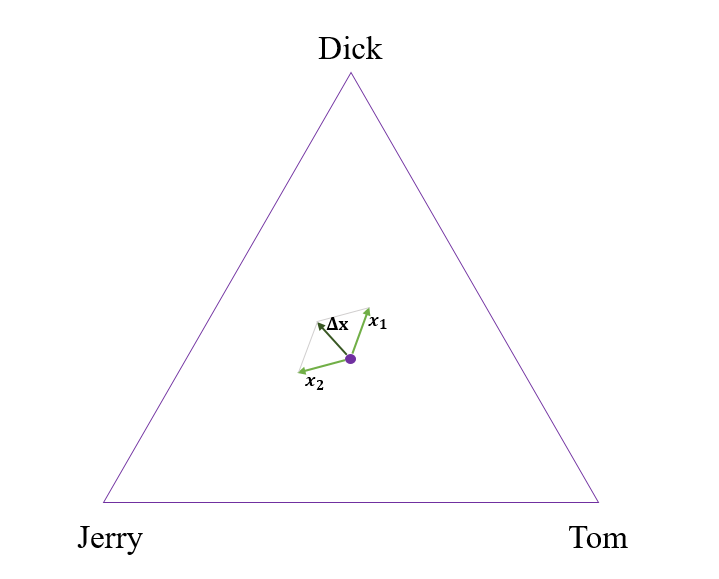
From these preference vectors, we can then add up the vectors across people to determine the direction in which the position in the triangle evolves. Figure 2 above depicts an example of a simple two-voter system. In this example, person 1’s vector points most closely towards Jerry, while person 2’s vector points most closely towards Dick. After summing these two vectors, a small number times the resulting vector is added to the previous point in this triangle to get a new point. If that new point is outside the triangle, then the closest point on the boundary of the triangle is the new position instead. This procedure is then repeated until either a vertex is reached (decisive victory for one candidate) or all motion grinds to a halt because the votes exactly counterbalance one another.
It is important to note that we would not need or expect all voters to understand this triangular representation of the voting mechanism. Our focus is on designing a survey that lets individuals easily provide the information needed to calculate the direction a particular voter would most like to go, without them having to know this representation of their vote explicitly.
The voting process is a matter of giving a rating to each candidate on a scale from 0 to 100, where 0 is the rating for the least favored candidate and 100 is the rating for the most favored candidate. Giving a rating to each candidate allows a voter the options of:
- a straight “positive” vote, by rating the most favored candidate 100 and all other candidates 0,
- a straight “negative” vote, by rating the least favored candidate 0 and all other candidates 100,
anything in between a straight positive and a straight negative vote, by rating the least favored candidate 0, the most favored candidate 100 and other candidates in between.
Data Collection
In order to illustrate the process of having voters rate candidates, and investigate what type of votes people wanted to cast, we collected data on the University of Southern California’s Understanding America Study, between March 18 – 21, 2016, on preferences over the last five major party candidates standing at the time (Hillary Clinton, Ted Cruz, John Kasich, Bernie Sanders, and Donald Trump).
We asked participants who they believed would make the best President of the United States out of the five candidates, and then asked them who would make the worst. We set their “best” candidate at a rating of 100 and their “worst” candidate at a rating of 0. We had two different approaches for having each individual rate candidates after this point.
In our first approach, we simply asked participants to “rate the other candidates using a special scale, where [worst candidate] is a 0 and [best candidate] is a 100”, with no other instructions. Let’s refer to this approach as “unstructured ratings.”
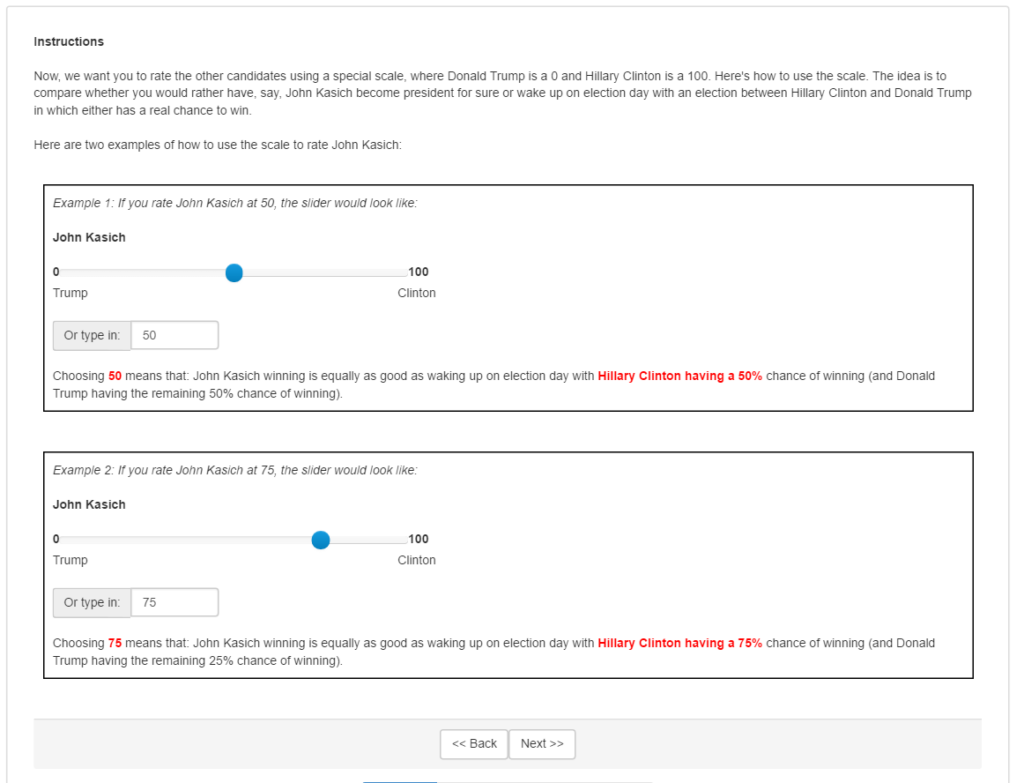
In our second approach, we seek to elicit participants’ expected utilities for each candidate. That is, we want to identify how much each participant would value having each candidate as president compared to the other candidates. In doing so, we explained that choosing a rating X on the scale indicates that the participant feels indifferent between the following two situations: (1) knowing for sure that the candidate they are rating will be president, and (2) waking up on election day with their favorite candidate having an X% chance of winning and their most disliked candidate having a (100-X)% chance of winning. Figure 3 is a screenshot of the directions each participant received in this approach, including two examples for clarity, in which the voter had chosen Donald Trump as the “worst” candidate and Hillary Clinton as the “best” candidate.
A priori we favor the expected-utility ratings over the unstructured ratings, but we will report results using the unstructured ratings for those who don’t share that view and to show that it matters what instructions were given regarding how to use the scale.
Converting the Ratings Into Votes
In the simplest, most straightforward implementation of the NGA mechanism, we construct each individual’s vector vote from their ratings as follows:
- Calculate the individual’s mean rating across all five candidates and the standard deviation of the individual’s ratings.
- For each candidate, starting with the individual’s rating of that candidate, subtract the individual’s mean and divide by the individual’s standard deviation.
This procedure normalizes an individual’s candidate ratings to have mean zero and variance one. That way, the vector vote of each individual is ensured to be of length one. Although there are other strategic voting issues we will return to below, the normalization prevents anyone from having more influence than other voters simply by giving all extreme ratings (all 0’s or 100’s). We refer to this restriction—equivalent to the vector in the triangle, tetrahedron or simplex representation having a maximum length of 1—as the “variance budget.” That is, each voter has a restricted amount of variance in their normalized vector, so in effect, voters cannot express a stronger opinion about one candidate without having to express less strong opinions about other candidates. Visually, this “budget” ensures that each voter’s preference vector is of the same length in figures 1 and 2.
The normalized ratings having a mean of zero represents something even more basic: since only one candidate will win in the end, one cannot raise the chances of one candidate without lowering the chances of at least some other candidates.
To us, there is an intuitive attraction to focusing on normalized ratings, even apart from the NGA motivation that led us to that focus. So we will use the normalized ratings extensively in our empirical analysis of the data.
Analyzing the Data
Who Would Win? The first question to ask of the data is who would have won? First, let’s see who would have won in our sample using the current voting system. We assume that participants vote for the candidate that they chose as the “best” candidate. Tables 1 and 2 show these results, broken up by unstructured and expected utility ratings. We see that in both types of ratings, Hillary Clinton outperforms the other candidates. Note that at this stage in the survey, both types of ratings ask the same question (“who would make the best candidate”), so it is expected that the results would be similar.
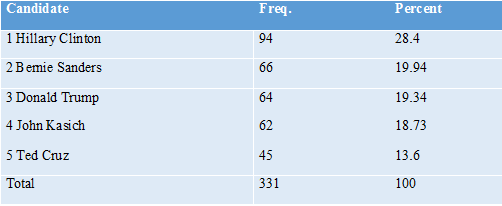
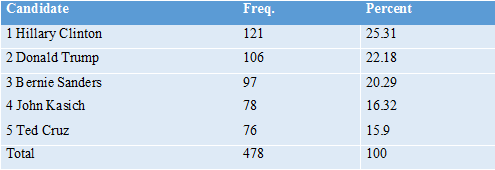
From these results, we see that Hillary Clinton would be the nominated Democrat in both rating types, and Donald Trump would be the nominated Republican in our sample. Of those two remaining candidates, our sample of participants would elect Hillary Clinton, with 459 participants who prefer her, over Donald Trump, with 325 participants who prefer him.
Now, let’s look at how these results would change if we consider NGA as a multicandidate voting mechanism, as previously described. In the simplest, most straightforward implementation of NGA for a multicandidate election, the victor is the candidate with the greatest sum of normalized ratings across voters. (Note that it is possible to repeat the process of adding a small vector based on the same information. Typically, this will lead first to a side or edge—one candidate being eliminated—and then to a vertex, one candidate being victorious.)
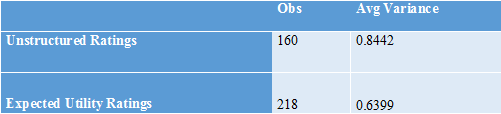
As a prediction of what would happen in an actual multicandidate election using NGA, the results from our data need to be taken with a large grain of salt for at least three reasons. First, our survey was conducted months before November 8, when voters’ knowledge of the five candidates was still relatively limited—not to mention in an election cycle with lots of dramatic “October surprises.” Second, the total number of survey respondents is relatively small, and our survey respondents are not fully representative of the actual population of voters, though every effort was made to make the UAS survey as representative as possible of the adult US population overall. And third, our survey respondents knew that their answers to our survey would not determine who would become president, and so they were not subject to incentives for strategic misreporting that would arise in a real-world multicandidate election using NGA. But that makes the data even more interesting as an indication of which candidate would have been most acceptable to a wide range of voters. Here are averages of the normalized ratings for both the sample that was asked to give unstructured ratings and the sample that was asked to give expected-utility ratings:
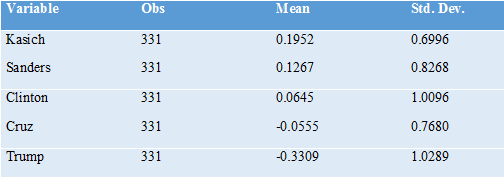
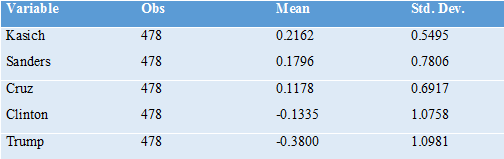
Thus, leaving aside any effects from strategic voting (and ignoring for the moment the timing of our survey and the non-representativeness of our sample), our data point to John Kasich as most likely to have won the election using NGA to resolve the multicandidate choice over all of these five candidates. While his mediocre performance under our current voting system suggests that he was not the favorite candidate of all that many voters, our respondents overall found him relatively acceptable.
Bernie Sanders has the second-to-highest average rating, despite not performing very well in the primary. Donald Trump has the lowest average rating by far, with Ted Cruz second-to-lowest using the unstructured ratings and Hillary Clinton second-to-lowest using the expected-utility ratings. The most interesting point to take away is that, by the expected utility ratings, out of these five candidates, the current general election has come down to the two candidates with the lowest average ratings. (This is in line with the low approval ratings for both Donald Trump and Hillary Clinton.)
Expected-Utility Ratings vs. Unstructured Ratings. A striking difference between the expected utility ratings and the unstructured ratings is the greater prevalence of tendencies toward lower normalized ratings with the expected utility ratings.
One way to illustrate this difference is to look at scatterplots of the most extreme rating (in absolute value) in the normalized ratings vs. the second most extreme rating in the normalized ratings. In figures 4 and 5 below, we can see whether participants’ most extreme preferences were for a certain candidate (indicated by points with a positive x value) or against a certain candidate (indicated by points with a negative x value).
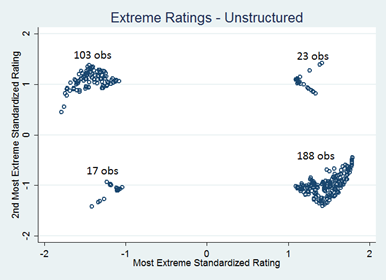
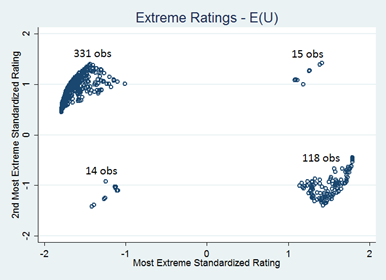
Out of the expected-utility vector votes, 345 have the most extreme normalized rating negative, compared to 133 that have the most extreme normalized rating positive. By contrast, out of the unstructured vector votes, 211 have the most extreme normalized rating positive, compared to 120 that have the most extreme normalized rating negative. This trend suggests that participants emphasize their negative feelings toward candidates more in the expected utility ratings as compared to in the unstructured ratings.
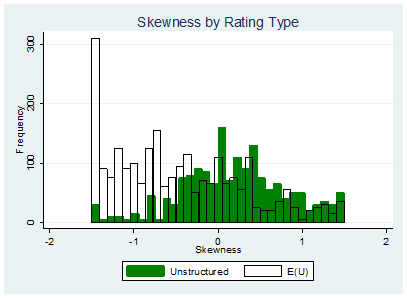
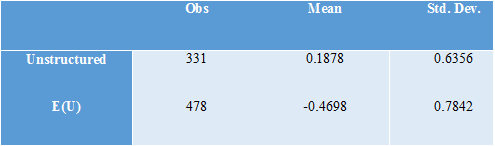
This stark contrast between the expected utility ratings and the unstructured ratings can further be seen through the notable differences in the shape of the distribution between these two types of ratings. Skewness describes respondents’ tendencies to rate some candidates much higher than average (skewness > 0) in comparison to the standard deviation of 1 or much lower than average (skewness < 0). Intuitively, a set of ratings with a positive skewness is somewhat closer to being a “positive” vote, while a set of ratings with a negative skewness is somewhat closer to being a “negative vote.” Figure 6 shows that in the unstructured ratings, skewness tends to be more positive than in the expected utility ratings. Table 5 gives summary statistics corresponding to this graph. This indicates that respondents are closer to casting “positive” votes in the unstructured ratings. The expected utility ratings, on the other hand, tend to have a more negative skew, and are thus closer to being “negative” votes. Table 5 emphasizes this point, by showing that the average skew for unstructured ratings is indeed positive, while the average skew for the expected utility ratings is strongly negative.
Thus, by both this measure of skewness and by the extreme ratings plots, the expected-utility ratings look closer to being negative votes (votes against a candidate) while the unstructured ratings look closer to being positive votes (votes for a candidate).
Why Are the Expected-Utility Ratings So Different from the Unstructured Ratings? A solid answer to the question of why the expected-utility ratings are so different from the unstructured ratings (and the related question of whether our a priori preference for the expected-utility ratings is justified empirically) would require additional data in another multicandidate election. But we are able to provide one hypothesis. Because our data were collected in the heat of the primaries, our respondents may have wanted to use the ratings to express their opinions about those primary battles, using a substantial portion of the 0 to 100 scale to express those opinions, and consequently squeezing down the amount of the scale left to express their opinions about the candidates in the party they favored less. The structure of expected-utility ratings would have pushed back against this tendency, asking the respondents, in effect, “Are you really willing to accept a substantial chance of your least favorite candidate winning in order to get your favorite candidate instead of your second- or third-choice?”
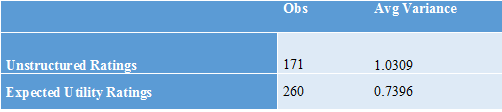
To see if this hypothesis is at all consistent with the data, consider the variance among an individual’s two or three ratings within the party of that individual’s favorite candidate. Tables 6 and 7 show that the within-party, within-voter variance is substantially greater for the unstructured ratings than for the expected utility ratings. This lends some support to the idea that those answering the unstructured ratings were more focused on the primaries, overstating their dislike for the “other” candidate(s) in the party, whereas in the expected utility ratings, participants were more likely to think about the general election and save more of the unit variance in normalized ratings for candidates in the other party.
Multiple-Stage NGA Voting
In the current voting system, strategic voting for someone other than one’s most preferred choice is a commonplace. So there is no reason to dismiss a new voting system for having some degree of strategic misreporting. But to allow voters the simplicity of truthful reporting in their ratings without hurting themselves too much, we view it as desirable to have the incentives for strategic misreporting be relatively small. Given the issues taken care of by the normalization of the ratings, the incentive for strategic misreporting we have worried most about is the incentive to avoid giving a strong negative rating to a candidate who is going to be eliminated anyway, since doing so would dilute the ratings assigned to other candidates. That is, there is an incentive to free ride on the elimination of widely disliked candidates. Fortunately, modifications of the NGA mechanism can help reduce this incentive or help insure reasonable results despite some degree of strategic voting.
One modification of the NGA mechanism helpful in dealing with free riding in the elimination of widely disliked candidates is to vote in stages. Rather than taking ratings at one point in time to guide movement all the way to a vertex with one candidate winning, one can have a series of nonpartisan “open primaries” in which the notional probabilities of a candidate winning if things were ended prematurely are adjusted some distance, but not all the way to one candidate winning. This gives voters a chance to see if a candidate many thought would be quickly eliminated is doing well, making it worthwhile spending some of one’s variance budget voting against them in the next stage. On the other hand, taking the ending point of the adjustments in notional probabilities from the nonpartisan open primary as the starting point for the next stage ensures that all voters have some reward for the voting efforts they make, even in the first stage.
Having multiple stages also serves other purposes. There could easily be candidates in an initially crowded field that voters simply don’t know much about and don’t want to invest in learning about because it seems those candidates have no chance. A nonpartisan open primary helps voters and journalists know which candidates are worth learning more about. (Also, one practical issue with the early “primaries” is the large number of candidates a voter might be asked to rate. One way to handle this is to include an option for casting a straight positive or straight negative vote that effectively fills in 0’s and 100’s for all the candidates accordingly.)
A Smoothed-Instant-Runoff Version of NGA for Multicandidate Elections
The NGA perspective from which we are looking at things suggests another, more technical way to reduce the incentive for strategic misreporting: using exactly the same kind of survey to elicit expected-utility ratings, but modifying the mechanism so that it automatically deemphasizes the ratings of candidates who are on their way out. This involves (a) demeaning using a weighted average that gives a low weight to candidates that have a currently low notional probability of winning, (b) slowing down (without stopping) the adjustment of notional probabilities that are already low, and (c ) steering vector votes toward focusing on candidates that still have a relatively high notional probability. There is a parameter that determines whether these three things happen only when the notional probability of a candidate is very low or more gradually. If these modifications happen only when the notional probability of a candidate is very low, the mechanism becomes a combination of the simplest implementation of NGA and the idea behind instant-runoff voting, where voters re-optimize once a candidate is eliminated. With less extreme values of the parameter, the spirit of instant-runoff voting is smoothed out. Regardless of that parameter, the basic NGA idea is preserved.
A downside of the smoothed-instant-runoff version of NGA for multicandidate elections is its complexity. It would still be fully verifiable, but those who do not fully understand it might be suspicious of it. Nevertheless, to the extent it makes one aspect of strategic voting happen automatically without strategic misreporting, it would put less sophisticated voters more on a par with the more sophisticated voters.
Incentives for Politicians
A great deal of research is needed to fully understand incentives for politicians under an NGA or Smoothed-Instant-Runoff NGA multicandidate voting system with multiple stages. However, we are willing to make some conjectures. If people view certain important candidates of an opposing party as “the devil,” the strong negative ratings for those “diabolical” candidates would open up an opportunity for centrist candidates like John Kasich whom few voters see as “diabolical.” It could even open up space for new centrist parties.
Undoubtedly there are other effects that are harder to foresee, but a system that allows people to express strong negative views about a candidate should help avoid many possible bad outcomes. And the NGA system still allows people to express strong positive views about a candidate if they so choose.
NOTE: Please consider this post the equivalent of a very-early-stage working paper. We would love to get comments. And just as for any other early-stage working paper, we reserve the right to copy wholesale any of the text above into more final versions of the paper. Because it is also a blog post, feel free to cite and quote. We want to thank Becky Royer for outstanding research and editorial assistance. The data used for the analysis can be downloaded here (registration required, see here). A description of the data can be found here, a Stata do file used to conduct the analysis is available here.
You must be logged in to post a comment.